Charts & drawing
This page shows you how to add a progress bar, a bar chart, a line chart or your own drawing to a pushed app or a notification.
New here?
How the display works shows where things sit on the display and which text moves by itself.
What you get
A download progress bar with a label. Replace <awtrix-ip> with the IP address of your clock:
curl -X PUT http://<awtrix-ip>/api/v1/apps/pushed/download \
  -H 'Content-Type: application/json' \
  -d '{"text":"64%","progress":64,"progressColor":"#00AAFF","progressTrackColor":"#404040"}'
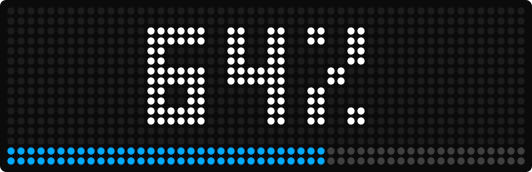
The label stands in the middle. The bottom row is the bar: blue for 64 % of its length, dark gray for the rest.
Every example on this page sends Content-Type: application/json. Without it, curl -d marks
the body as a form, and AWTRIX refuses a PUT with that
(Content-Type).
How it behaves
Four keys draw: progress, barChart, lineChart and draw. They go into the same JSON as the
text of the app.
- AWTRIX places the charts and the progress bar. The charts grow up from the bottom row, to the right of the icon. The progress bar is the bottom row.
- You place each drawing command.
xcounts the columns from the left andythe rows from the top, both from0. The icon does not move them. - A pushed app or a notification is drawn at double size, on a grid of 26 × 8. Its last
column is
25and its last row7:["pixel",25,7]lights the bottom-right corner. A larger position lies outside the grid and shows nothing. With the settingenlargeAppsoff, it uses all 52 × 16 pixels. - Drawn text stands still. In a
textcommand,yis the top row of the letters in the default font. What does not fit is cut off. - Charts and drawings lie over the text, unless
textInFrontis on.
How the display works explains the grid, the icon area and the layers with pictures.
Draw a progress bar
progress is a percentage. The bar fills the bottom row from the left.
curl -X PUT http://<awtrix-ip>/api/v1/apps/pushed/build \
  -H 'Content-Type: application/json' \
  -d '{"text":"BUILD","progress":30,"progressColor":"#00FF00","progressTrackColor":"#FFFFFF"}'
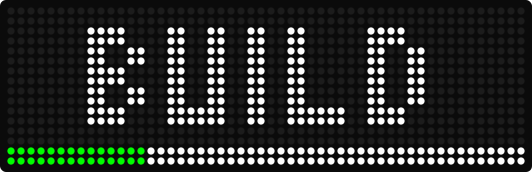
progressColoris the filled part,progressTrackColorthe rest of the row. The rest is always drawn. To hide it, give it the color of your background.- To show no bar, send
-1or leave the key out.0draws the whole row inprogressTrackColor.
Draw a bar chart
barChart takes a list of whole numbers, one bar each, up to 16. The bars share the width, with
a gap of 1 pixel between them.
curl -X PUT http://<awtrix-ip>/api/v1/apps/pushed/traffic \
  -H 'Content-Type: application/json' \
  -d '{"barChart":[2,5,3,8,6,4,7,1],"chartColor":"#00FF00"}'
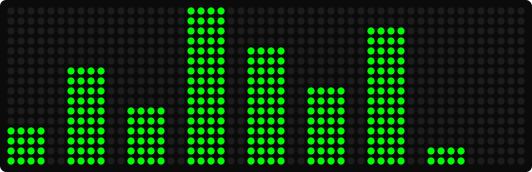
chartColor colors the bars. Without it, they take the text color. Between the bars, the
background shows through.
The scale. chartAutoscale decides which value reaches the top row:
curl -X PUT http://<awtrix-ip>/api/v1/apps/pushed/traffic \
  -H 'Content-Type: application/json' \
  -d '{"barChart":[1,3,2,4],"chartColor":"#00FF00"}'
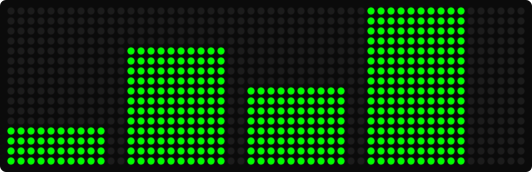
The largest value reaches the top, so [1,3,2,4] and [10,30,20,40] look the same. Good for
a trend.
curl -X PUT http://<awtrix-ip>/api/v1/apps/pushed/traffic \
  -H 'Content-Type: application/json' \
  -d '{"barChart":[1,3,2,4],"chartAutoscale":false,"chartColor":"#00FF00"}'
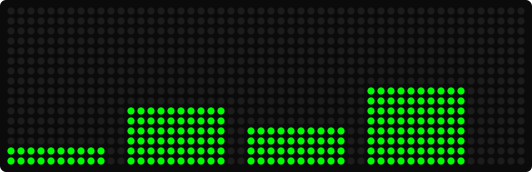
With "chartAutoscale":false, 8 always reaches the top, so 4 fills half the height.
Larger values are cut off at the top. Use it when the number itself matters.
Draw a line chart
lineChart takes a list of whole numbers and draws a line through them, from the left edge to the
right edge. It needs at least 2 values.
curl -X PUT http://<awtrix-ip>/api/v1/apps/pushed/temp \
  -H 'Content-Type: application/json' \
  -d '{"lineChart":[3,4,6,5,7,8,6,4],"chartColor":"#FF8800"}'
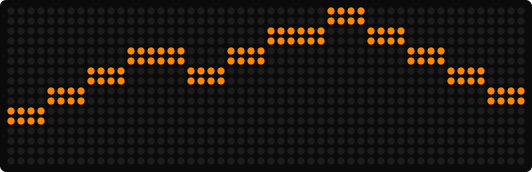
It takes the same chartAutoscale and chartColor as the bar chart, and up to 16 values too.
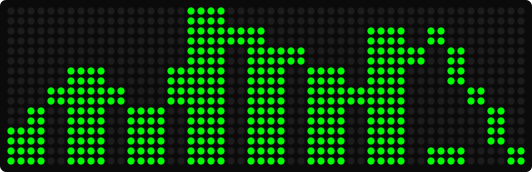
Send both charts, and the line lies over the bars, in the same color:
curl -X PUT http://<awtrix-ip>/api/v1/apps/pushed/combo \
  -H 'Content-Type: application/json' \
  -d '{"barChart":[2,5,3,8,6,4,7,1],"lineChart":[2,5,3,8,6,4,7,1],"chartColor":"#00FF00"}'
Draw commands
draw is a list of commands. Each command is itself a list, with the command name first and
its values after it. All nine commands and their values, in one table:
Draw commands.
curl -X PUT http://<awtrix-ip>/api/v1/apps/pushed/art \
  -H 'Content-Type: application/json' \
  -d '{"draw":[
        ["rect",0,0,26,8,"#444"],
        ["circleFill",4,4,2,"#F00"],
        ["text",9,1,"HI"]
      ]}'
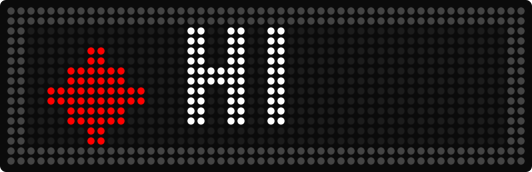
The frame is dark gray and the dot red. HI takes the text color of the app, because its command
has no color of its own. It stands still, with the top of its letters on row 1.
- Commands are drawn in list order. Where two overlap, the later one is on top.
- The color at the end is optional. Without it, a command uses the text color of the app.
pixelstakes its color first, andbitmaphas no color of its own. - A wrong command stops the whole request. The answer is
422 validationFailed, and"field":"draw[2]"points at the third command. Nothing is changed.
The commands: pixel, pixels, line,
rect and rectFill, circle and circleFill,
text and bitmap.
Draw a pixel
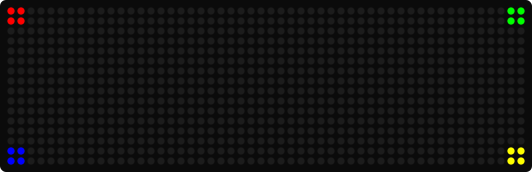
pixel lights one pixel at x, y. Four of them mark the corners, a quick check of your positions:
curl -X PUT http://<awtrix-ip>/api/v1/apps/pushed/corners \
  -H 'Content-Type: application/json' \
  -d '{"draw":[
        ["pixel",0,0,"#F00"],
        ["pixel",25,0,"#0F0"],
        ["pixel",0,7,"#00F"],
        ["pixel",25,7,"#FF0"]
      ]}'
Draw many pixels
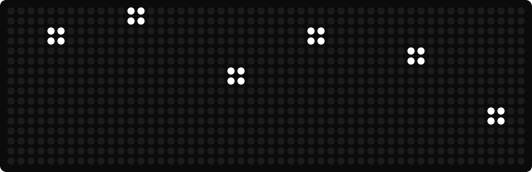
pixels takes one color and then a list of x, y pairs. For many points in one color, it is much
shorter than one pixel command per point.
curl -X PUT http://<awtrix-ip>/api/v1/apps/pushed/stars \
  -H 'Content-Type: application/json' \
  -d '{"draw":[["pixels","#FFF",2,1,6,0,11,3,15,1,20,2,24,5]]}'
Draw a line
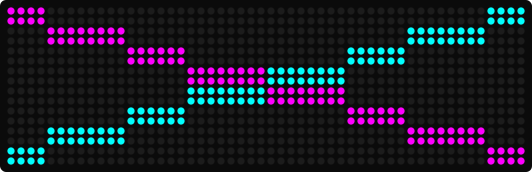
line takes the two end points, and both are drawn.
curl -X PUT http://<awtrix-ip>/api/v1/apps/pushed/cross \
  -H 'Content-Type: application/json' \
  -d '{"draw":[
        ["line",0,0,25,7,"#F0F"],
        ["line",0,7,25,0,"#0FF"]
      ]}'
Draw a rectangle
rect draws a 1-pixel outline, rectFill a filled rectangle. The values are x, y, width, height.
Width and height are a size, not a second corner.
curl -X PUT http://<awtrix-ip>/api/v1/apps/pushed/box \
  -H 'Content-Type: application/json' \
  -d '{"draw":[
        ["rect",2,1,12,6,"#FFF"],
        ["rectFill",16,2,8,4,"#F00"]
      ]}'
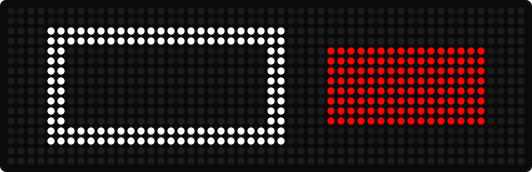
The white outline covers the columns 2 to 13 and the rows 1 to 6.
Draw a circle
The values are x, y, radius. x and y are the center.
curl -X PUT http://<awtrix-ip>/api/v1/apps/pushed/rings \
  -H 'Content-Type: application/json' \
  -d '{"draw":[
        ["circle",8,4,3,"#0F0"],
        ["circleFill",18,4,3,"#F00"]
      ]}'
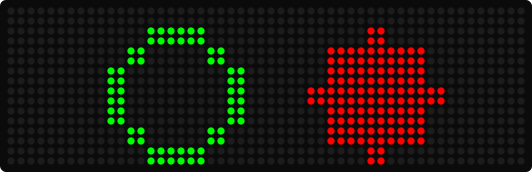
A radius of 3 makes a circle 7 pixels wide.
Draw text
text writes one line at x, y. It stands still: what does not fit is cut off at the edge.
curl -X PUT http://<awtrix-ip>/api/v1/apps/pushed/label \
  -H 'Content-Type: application/json' \
  -d '{"draw":[["text",1,1,"12:30","#FA0"]]}'
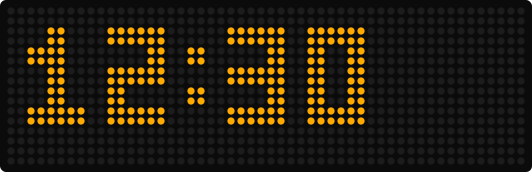
In the default font small, y is the top row of the letters: y = 1 puts the capitals on rows 1
to 5, the rows the app's own text uses.
A text command has no font of its own. It uses the font of the app: set font next to draw,
and every text command in the list uses it.
curl -X PUT http://<awtrix-ip>/api/v1/apps/pushed/label \
  -H 'Content-Type: application/json' \
  -d '{"font":"matrix-light6","draw":[["text",1,1,"12:30","#FA0"]]}'
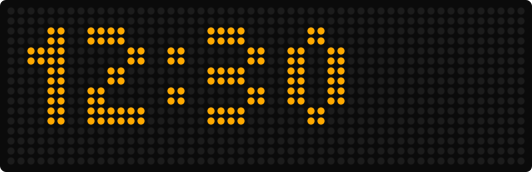
In every font, y = 1 puts the letters on the rows of the app's own text. A taller font such as
large then fills rows 0 to 6. All fonts: The fonts.
To show two fonts at once, for example a large clock next to a small label, use a
layout: each box there has its own font.
For text that moves, is styled or is centered for you, use the text key: see
Text & colors.
Draw a bitmap
A bitmap is a small image, given pixel by pixel. The values are x, y, width, height and then the
pixels, row by row from the top-left. Give the pixels as a list of colors, or as a base64 text of
raw RGB bytes, 3 bytes per pixel.
# A 4x2 red-and-green checkerboard in the top-left corner
curl -X PUT http://<awtrix-ip>/api/v1/apps/pushed/bmp \
  -H 'Content-Type: application/json' \
  -d '{"draw":[["bitmap",0,0,4,2,[
        "#F00","#0F0","#F00","#0F0",
        "#0F0","#F00","#0F0","#F00"
      ]]]}'
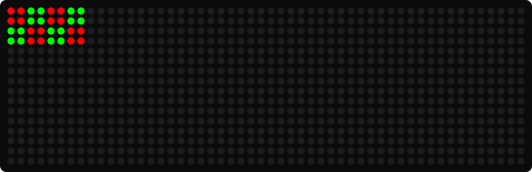
For a large image, base64 is much shorter. See Keep the request small.
Show a chart next to an icon
With an icon, the charts and the progress bar move to the right of it. The icon takes its own
width and a gap of 1 pixel: 9 columns for an 8-pixel icon.
curl -X PUT http://<awtrix-ip>/api/v1/apps/pushed/weather \
  -H 'Content-Type: application/json' \
  -d '{"icon":"sun","lineChart":[3,4,6,5,7,8,6,4],"chartColor":"#FF8800"}'
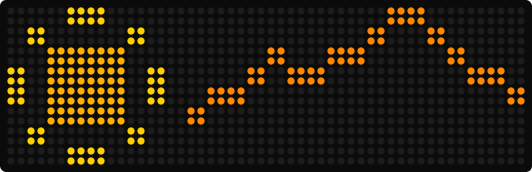
barChartandlineChartstart after the gap, atx = 9.progressstarts right at the edge of the icon, atx = 8.drawcommands ignore the icon. Their positions count from the left edge of the display, and the icon is drawn over them.
sun is an icon from the AWTRIX Hub.
Put the text in front of a chart
The text lies under charts and drawings. textInFront: true puts it on top:
curl -X PUT http://<awtrix-ip>/api/v1/apps/pushed/cpu \
  -H 'Content-Type: application/json' \
  -d '{"text":"CPU","textInFront":true,"barChart":[2,5,3,8,6,4,7,1],"chartColor":"#040"}'
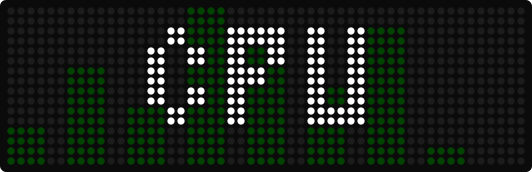
Without textInFront, the bars cover the letters. It changes only what is on top: the text stays
where it is.
The other layers keep their order: the draw commands first, then progress, barChart and
lineChart, then the icon. An overlay such as rain is drawn over everything. Below everything
is the background: the effect if there is one, else backgroundColor, else black. See
Effects & overlays.
Keep the request small
A request can be at most 2 MiB over HTTP, and 8192 bytes over MQTT with the topic included. See Limits. Four tips keep a detailed drawing below that:
- Use short colors.
#F00is the same as#FF0000. Each digit is doubled, so#1A2means#11AA22. - Leave the color out. A command without a color uses the text color. If most of your drawing
has one color, set
textColoronce and leave the color out everywhere else. - Group your points. One
pixelcommand per point takes the most space.["pixels","#0F0",0,0,1,1,2,2]names the color once, so a hundred points need about a quarter of the space. - Send bitmaps as base64. For a full-display image, base64 is much shorter than a list of colors.
Good to know
- The answer is
200 {"ok":true}, but nothing shows. Every key was accepted, so check the position and the size: the shape lies outside the grid of 26 × 8, or a width, height or radius is 0 or less. - A rectangle takes a size, not a second corner. For the columns 2 to 13, the width is
12. - A line chart needs 2 values. A single value draws nothing.
- The chart starts at the left edge, although you sent an
icon. The icon is missing on the clock or cannot be read, so the app is laid out without it. Check its ID, see Icons. - Drawn text has no style.
textCase,palette,textBlinkMs,textFadeMs,textAlignand the settinguppercasedo not change it. Use thetextkey for styled text.
Details
- Charts: every chart key, the scale and negative values
- Progress bar: its keys and defaults
- Draw commands: all nine commands with their values
- Render order: every layer of an app, from the background to the overlay
- Colors: the five color forms, for example
"#F00"or[255,0,0] - Limits: the size of a request
- Errors: every error code
Related
- App & notification payload: every key, type, range and default
- Visual reference: colors, palettes and the display layout
- Text & colors: the
textkey, styling and scrolling - Effects & overlays: animated backgrounds and weather effects
- Layouts: split the display into boxes with their own text, icon or chart
- Pushed apps: sending, expiry and the rotation
- Scripting guide: draw the same things from your own program on the clock