Tutorial 1: Draw something
This is the first of three tutorials that build one app step by step. At the end of the third, your display shows the chance of rain for the next sixteen hours. The data comes from a real weather service, and you set the location in the web UI.
In this first tutorial you draw a picture.
| Tutorial | What it adds |
|---|---|
| Tutorial 1: Draw something | pixels on the display, from numbers you type in yourself |
| Tutorial 2: Give it a memory | state, a clock, and a setting the user can change |
| Tutorial 3: Feed it real data | a real forecast over the network |
You need an AWTRIX on your network and a browser.
Make the script
Open the web UI, go to the Scripts tab, and create a script called Rain.
Paste this in and press Save, or Ctrl-S:
# @name Rain
# @desc Chance of rain, hour by hour

class Rain
  def draw()
    clear()
    text(1, 6, "rain", 0x0088FF)
  end
end

return Rain()

Your app is now in the rotation, the list of apps that take turns on the display. Wait a
few seconds until it comes up, or press the right button on the device to skip to it. The
display shows rain in blue. The 1 and the 6 in text() are its position on the
display, explained below.
That is a complete app. Three things make it one:
It is a class. Everything the app owns lives inside it. Two scripts can both use
class Rain without problems, because each script is kept separate.
It has a draw(). This is the only method an app must have. AWTRIX calls it about
forty times a second while your app is the one shown, and whatever it paints is
the frame.
It ends with return Rain(). That hands AWTRIX the instance to run.
The editor knows the API
Built-in calls are highlighted in their own color, and Ctrl-. completes
them. A misspelled pixel stays plain, so you see it before you save. The list
always matches the firmware on your device.
When it goes wrong
Nothing you do here can harm the device. A broken script breaks only itself: the display
shows ERR: in red when its turn comes, every other app keeps running, and saving the
script again clears it. The message is waiting next to your script in the Scripts
tab.
These are the three errors you will meet most often, with the exact words AWTRIX uses:
| Message | What happened |
|---|---|
script must end with 'return YourApp()' |
the last line is missing |
no draw() method |
the class has no draw(), so there is nothing to paint |
syntax_error: unexpected token … |
usually a missing end |
Berry closes every if, for, while, def and class with end. A missing end is
the most common mistake. The line number in the message is often after the line with the
mistake, sometimes several lines after. Look upwards from it.
Errors that only happen while the app runs are shown the same way. "x" + 5 raises
type_error: unsupported operand type(s) for +: 'string' and 'int', because Berry does not
join a number to a string for you. Write "x" + str(5).
How the display is addressed
The display is a grid of pixels, 52 wide and 16 tall. x counts the
columns from 0 on the left. y counts the rows from 0 at the top, so a larger y is
further down.
Light one pixel in each corner. The two pixel() lines go inside draw(), next to the
text() call you already have:
# @name Rain
# @desc Chance of rain, hour by hour

class Rain
  def draw()
    clear()
    text(1, 6, "rain", 0x0088FF)
    pixel(0, 0, 0xFF0000)                        # top left
    pixel(width() - 1, height() - 1, 0x00FF00)   # bottom right
  end
end

return Rain()
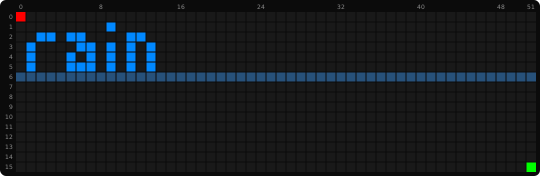
The red pixel is (0, 0). The green one is (51, 15).
In text(), y is the baseline, not the top. The baseline is the line the letters stand
on. text(1, 6, …) puts it on row 6, tinted in the picture. The letters sit right above it,
on rows 1 to 5. x = 1 is the column where the first letter starts. A second line goes 8 rows
lower, at y = 14. Other fonts fill other rows:
Where text sits lists them.
Use width() and height() instead of writing 52 and 16. Other clocks have a different display
size, and a script that asks adapts to them automatically.
Anything you draw outside the display is cut off. Drawing at x = 500 is not an error. It
just does not appear, so a chart that is too long cannot crash your app.
How the display works explains the grid with more pictures.
Colors are just numbers
A color is a single number. What a color picker calls #0088FF is 0x0088FF here.
These three lines paint exactly the same blue, three different ways:
    text(1, 6, "rain", 0x0088FF)            # written directly
    text(1, 6, "rain", rgb(0, 136, 255))    # from channels, each 0 to 255
    text(1, 6, "rain", hsv(208, 100, 100))  # from hue 0 to 360, sat and value 0 to 100
hsv() is useful when the color should follow a value. We use it later on this page.
The LEDs are very bright in a dark room. 0xFFFFFF is fine for a few letters. For larger
areas, something like 0x202020 is enough. Strong colors at medium brightness are easier
to read than the same color at full brightness.
Center the text properly
A fixed start position stops working when the text changes length. Measure the text instead:
# @name Rain
# @desc Chance of rain, hour by hour

class Rain
  def draw()
    clear()
    var s = "rain"
    text((width() - text_ink_width(s)) / 2, 6, s, 0x0088FF)
  end
end

return Rain()
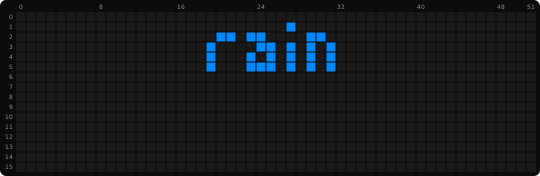
text_ink_width() measures only the lit pixels, so use it to center text. text_width()
also counts the small gap after the last letter, so use it when you put two texts side
by side.
Now the bars
The app should show sixteen numbers, one per hour, each a percentage.
We do not have real numbers yet, so type some in. The code stays the same when the real numbers arrive in tutorial 3.
# @name Rain
# @desc Chance of rain, hour by hour

class Rain
  var hours

  def init()
    self.hours = [0, 0, 5, 20, 45, 70, 90, 60, 30, 10, 0, 0, 15, 40, 25, 5]
  end

  def draw()
    clear()
    var h = height()
    var w = width() / size(self.hours)
    for i : 0 .. size(self.hours) - 1
      var v = self.hours[i]
      var bar = v * h / 100
      if bar > 0
        rect_fill(i * w, h - bar, w, bar, 0x0088FF)
      end
    end
  end
end

return Rain()
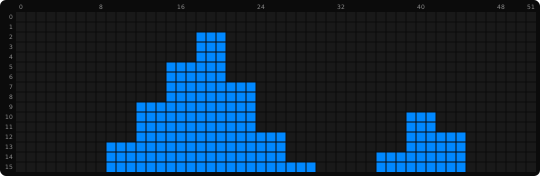
Sixteen bars side by side. w is the width of one bar: the display width divided by the number
of bars.
On the 52 pixel display each bar is three pixels wide. The four columns left over on the right
stay dark.
This code has three new parts.
var hours and init(). A value the app needs to remember lives in a member (a
variable that belongs to the app). You declare it with var at the top of the class and
give it a value in init(), which runs once when the app starts. Members keep their value
from one frame to the next.
Declare every member, and give it a value
Berry lets you assign to a member you never declared, so self.total = 0 somewhere
works. Reading a member you never declared does not. It raises
attribute_error: the 'Rain' object has no attribute 'total' and the display shows
ERR:. A var line at the top of the class and a value in init() prevent this.
The loop. for i : 0 .. size(self.hours) - 1 goes through every position in the list.
Berry writes ranges with .., and every block closes with end.
The arithmetic. v * h / 100 scales a percentage into pixels. Multiply first, then
divide. Two whole numbers divided in Berry give a whole number, so v / 100 * h would
turn every bar under 100% into zero.
The if bar > 0 check makes an hour with zero percent draw nothing at all. So you can see
the difference between "no rain" and "a little rain".
Let the color carry the meaning
A 52 × 16 display has no room for a legend, so color has to show the meaning.
    for i : 0 .. size(self.hours) - 1
      var v = self.hours[i]
      var bar = v * h / 100
      if bar > 0
        rect_fill(i * w, h - bar, w, bar, hsv(208, 100, clamp(v, 25, 90)))
      end
    end
hsv(208, 100, v) keeps the color blue and lets the brightness follow the percentage. A
likely hour is bright, an unlikely one is dim. clamp(v, 25, 90) keeps the dimmest bar
visible and the brightest one comfortable to look at.
The bar height already shows the number. Brightness shows it a second time, so you can read the chart from across the room.
The finished script
# @name Rain
# @desc Chance of rain, hour by hour
# @version 1.0

class Rain
  var hours

  def init()
    self.hours = [0, 0, 5, 20, 45, 70, 90, 60, 30, 10, 0, 0, 15, 40, 25, 5]
  end

  def draw()
    clear()
    var h = height()
    var w = width() / size(self.hours)
    for i : 0 .. size(self.hours) - 1
      var v = self.hours[i]
      var bar = v * h / 100
      if bar > 0
        rect_fill(i * w, h - bar, w, bar, hsv(208, 100, clamp(v, 25, 90)))
      end
    end
  end
end

return Rain()

Change a number in the list and save. The display changes immediately. Try it a few times: you will work this way in the next two tutorials.
What you learned
- An app is a class with a
draw()and a finalreturn YourClass(). draw()runs about forty times a second and paints one frame from what the app already knows.xcounts the columns from the left,ythe rows from the top. Intext(),yis the baseline the letters stand on.width()andheight()beat hardcoded numbers.- Colors are integers, and
hsv()is how you make one follow a value. - Members declared with
varand set ininit()are how an app remembers anything.
Next
Tutorial 2: Give it a memory lets the app change the sixteen numbers by itself. They change on a timer, the app keeps its last values after a reboot, and the user can pick the color in the web UI without editing code.
Related
- How the display works – where things sit on the display, with pictures
- Scripting guide – the full reference for every call used here
- Charts & drawing – all drawing calls