Drawing
Paint text, shapes, icons, charts and effects on the display from your script's draw().
New here?
How the display works shows where things sit on the display and which text moves by itself.
What you get
# @icons sun

class Weather
  def draw()
    clear()
    icon("sun", 0, 0)
    text(10, 6, "21°C", 0xFFFFFF)
  end
end

return Weather()
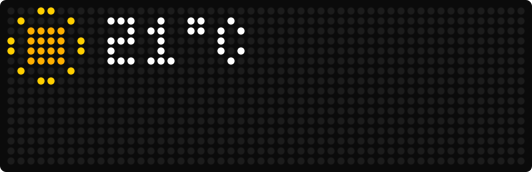
An icon at the left edge and a temperature next to it. The examples further down show only the
methods. Put them into your class, next to draw(), with return YourClass() at the end of the
file.
How it behaves
draw()paints one still frame, about 40 times a second, on a black display. Nothing moves unless you draw it somewhere else in the next frame, or use a call that moves by itself:scroll_text(),ramp_text()with a speed, an animated GIF icon or an effect.- Positions are pixels, counted from
0:xfrom the left,yfrom the top. Usewidth()andheight()instead of fixed numbers. Anything outside the display is cut off. That is never an error. - What
x, ynames depends on the call: the top-left corner forpixel(),rect(),rect_fill()andicon(), the center forcircle()andcircle_fill(), the two end points forline(), and the baseline, the line the letters stand on, for the text calls. text()never moves. What does not fit is cut off at the edge.scroll_text()stands still when the text fits, and moves it when it does not.- A color is one number,
0xRRGGBB:#FF0000on the web is0xFF0000here.rgb()andhsv()build one from its parts.
How the display works explains the model with pictures.
Write text
text(x, y, str, color?) writes one line. y is the baseline: with the small font, y = 6 puts
the capitals on rows 1 to 5. Other fonts fill other rows. The table in
How the display works lists them.
The lower half of the display is 8 rows further down: y = 14 puts the capitals on rows 9 to 13.
class Cpu
  def draw()
    clear()
    var adv = text(1, 6, "CPU ", 0x888888)
    text(1 + adv, 6, "42%", 0x00FF00)
  end
end

return Cpu()
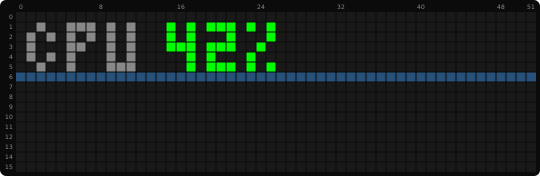
text() returns how far it moved right, so the second call starts where the first one ended.
Leave the color out and the text uses the device's text color (the
textColor setting), like the built-in apps.
Center a text
text_ink_width() measures how wide the lit pixels are. Subtract it from the width and halve
the rest:
class Degrees
  def draw()
    clear()
    var s = "21°C"
    text((width() - text_ink_width(s)) / 2, 6, s, 0xFFFFFF)
  end
end

return Degrees()

text_width() also counts the small gap after the last letter. Use it to chain text, and
text_ink_width() to center it.
Text in several colors
Anywhere a call takes a string, it also takes a list of pieces, each [text, color]:
class Cpu
  var parts

  def init()
    self.parts = [["CPU ", 0x888888], ["42%", 0x00FF00]]   # built once
  end

  def draw()
    clear()
    text(1, 6, self.parts)
  end
end

return Cpu()
The pieces form one line: they measure, center and scroll together, so scroll_text() and the
measuring calls take the same list. A piece written as a plain string, or as ["text"] without a
color, uses the color of the call. font() applies to all pieces. A
pushed app does the same when its text is a list.
Write script text in UTF-8. Type "21°C" or "Crème brûlée" straight into your source.
text(), text_width(), text_ink_width() and ramp_text() count a ° as one character. Which
characters the fonts have is listed in Text & colors.
Fonts
font(name) switches the font for the rest of the frame. text(), ramp_text(), scroll_text()
and both measuring calls follow it, so centering still works after a switch. The font resets every
frame, so set it in draw(), not in setup().
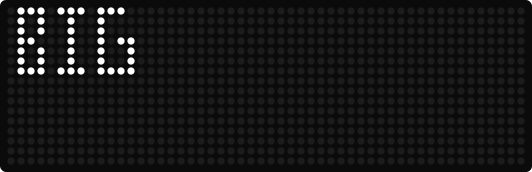
large is seven rows tall: at y = 6 its capitals fill rows 0 to 6. Besides small and
large, font(name) takes the ten Matrix-Fonts IDs. The editor's font menu inserts the IDs your device offers. An
unknown name keeps the current font. Which y lines up a font with the apps is in
How the display works, the catalog in
Text & colors → Fonts.
Text that may not fit
scroll_text() draws a line that moves by itself when it is too long, the way a pushed app's text
does. It returns how many times the text has run through.
| Call | Does |
|---|---|
scroll_text(str, color?, opts?) |
a line across the whole display, at the height apps use for the current font |
scroll_text(x, y, w, str, color, opts?) |
the same, only in the columns x to x + w - 1, with y as the baseline |
Across the whole display
class News
  def draw()
    clear()
    scroll_text("A HEADLINE TOO LONG FOR THE DISPLAY", 0x00AAFF)
  end
end

return News()

Text that fits stands still, in the middle. Without a color, the text uses the device's text color. Instead of a string you can pass a list of colored pieces.
Next to an icon
The second form gives the text the columns x to x + w - 1. Nothing is painted outside them,
so an icon beside them stays untouched:
# @icons sun

class Room
  def draw()
    clear()
    icon("sun", 0, 0)
    scroll_text(9, 6, width() - 9, "Living room 21.5°C", 0xFFFFFF)
  end
end

return Room()
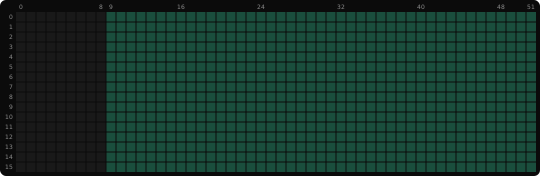
y is the baseline, as in text(). Text that fits stands still in the middle of its columns.
Keep the app until the text was read
Your app still leaves after its usual time, even in the middle of the text.
{"repeat": 1} keeps it until the text has run through once:
class News
  var once

  def init()
    self.once = {"repeat": 1}   # built once
  end

  def draw()
    clear()
    scroll_text("A HEADLINE TOO LONG FOR THE DISPLAY", 0x00AAFF, self.once)
  end
end

return News()
Two moving texts at once
A script can move two texts at a time, each in its own place: another y, or other columns.
class Two
  def draw()
    clear()
    scroll_text(0, 6, width(), "THE FIRST LINE MOVES ON ITS OWN", 0xFFFFFF)
    scroll_text(0, 14, width(), "AND SO DOES THE SECOND ONE", 0x00AAFF)
  end
end

return Two()

A third moving text makes all of them start over in every frame, so none moves. To show more lines, give each line its own turn:
class News
  var lines, i

  def init()
    self.lines = ["first headline", "second headline", "third headline"]
    self.i = 0
  end

  def draw()
    clear()
    scroll_text(self.lines[self.i], 0xFFFFFF)
  end

  def on_hide()
    self.i = (self.i + 1) % size(self.lines)   # the next line on the next turn
  end
end

return News()
How the text moves
opts is a map with the same keys a pushed app sends under
scroll, plus repeat. Keys you leave out follow the
device's scroll settings.
| Key | Value | Meaning |
|---|---|---|
mode |
"static", "wrap", "loop", "bounce" |
how the line moves |
speed |
percent, 100 = 21 px/s |
how fast |
gap |
pixels | space between repeats in loop |
holdMs |
milliseconds | pause before it starts, and at each end in bounce |
direction |
"left", "right" |
which way |
entry |
"inline", "offscreen" |
start in place, or slide in from the edge |
whenFits |
"static", "scroll" |
whether a short line moves at all |
repeat |
count | runs to finish before the rotation may move on. 0, the default, never holds |
Text in a color ramp
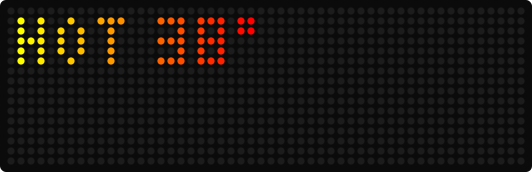
ramp_text(x, y, str, palette, span?, speed?) colors the text column by column from a
palette. It returns how far it moved right and chains like text(). span is the
width in pixels of one full pass of the palette (0, the default, stretches one pass across the
text), speed is passes per second (0 holds still).
Shapes
class Shapes
  def draw()
    clear()
    rect(0, 0, width(), height(), 0x333333)
    line(2, 1, 8, 6, 0x00FF00)
    circle_fill(13, 3, 2, 0xFFD700)
    rect_fill(18, 2, 6, 4, 0x0088FF)
    pixel(27, 3, 0xFF0000)
  end
end

return Shapes()
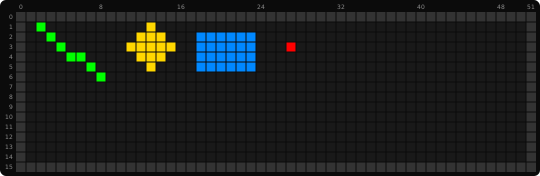
rect()andrect_fill()take the top-left corner and a size:rect(0, 0, width(), height())outlines the whole display.circle()andcircle_fill()take the center and the radius.line()takes both end points and draws them both.- Later calls paint over earlier ones.
Icons
icon(name, x, y) draws an installed icon with its top-left corner at (x, y). See
Icons. Use the file name without path or extension, or pass the image itself as a
data URL (data:image/gif;base64,… or data:image/jpeg;base64,…). A JPG is 8×8. A GIF has its
own size and must fit your display. Call icon() in draw() and an animated GIF plays by itself.
icon() also takes a web address such as "https://example.com/cover.jpg". The
picture fills a square as tall as the display, with its top left corner at (x, y). icon()
returns false until the picture has arrived, so draw something in its place meanwhile. More:
Pictures from the internet.
To show several icons, call icon() several times. Each GIF keeps its own colors and speed. This
example draws four 8×8 icons from the AWTRIX Hub side by side, 32 pixels wide. The
# @icons line is explained below:
# @icons sun, cloud, rain, wind

class Row
  def draw()
    clear()
    icon("sun", 0, 0)
    icon("cloud", 8, 0)
    icon("rain", 16, 0)
    icon("wind", 24, 0)
  end
end

return Row()
- If icons overlap, the later call draws on top. A full-width GIF at
(0, 0)covers the display. - The same icon at two positions shows the same frame in both places.
- An animated icon starts from its first frame each time your app appears.
- Up to 4 different icons can be drawn in one frame. Calls for a fifth return
false.
icon() also returns false when the icon cannot be shown: the file is missing, or the device is
short of memory. Draw a placeholder in that case:
The icons your script needs
icon() only draws what is already on the clock. Name the icons your script draws in the header,
and they travel with it:
- Each value is the name of an icon on the AWTRIX Hub.
- Separate them with commas or spaces. Use as many
# @iconslines as you like, up to 32 icons. - Anything after a
#on the line is a comment:# @icons sun, cloud # for the forecast.
You do not upload these icons yourself.
- From the Hub: installing a script from its Hub page brings its icons along. So do updates and scripts installed as a dependency.
- Pasted or imported by hand: press one button. In the script editor, a toolbar button shows how many are missing. On the Apps tab, the row menu offers Install icons.
Icons already on the clock stay as they are. An ID the Hub does not have is named in a message. The other icons still arrive.
Downloads need your Hub connection key under System → AWTRIX Hub. Get it from your Hub account. Installed icons keep working without the key. New downloads and reloads need a valid key.
Charts and progress
The same charts a pushed app shows, drawn by your script. They take the same values as a pushed
app's barChart, lineChart and progress keys.
class Load
  var values

  def init()
    self.values = [3, 5, 2, 8, 6, 4, 7, 1]   # built once
  end

  def draw()
    clear()
    bar_chart(self.values, 0x00AA00)
    progress(64, 0x00AAFF, 0x101010)
  end
end

return Load()
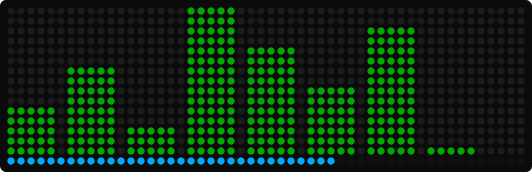
progress() always fills the bottom row, from x0 to the right edge. For a bar in another row,
draw it with rect_fill().
Draw an icon at (0, 0) and give the chart x0 = 9 to keep it clear of the icon:
A chart that follows a value over time keeps its values in a member and adds one in loop():
class Cpu
  var samples, pct

  def init()
    self.samples = []
    self.pct = 0
  end

  def loop()
    var v = second() % 8                    # <- your own data source (0..7 here)
    self.samples.push(v)
    if size(self.samples) > 16 self.samples.remove(0) end
    self.pct = v * 100 / 7                  # progress() takes 0-100
  end

  def draw()
    clear()
    line_chart(self.samples, 0x00FF00)
    progress(self.pct, 0x00AAFF, 0x101010)
  end
end

return Cpu()
Effects and overlays
effect(name) paints one of AWTRIX's animated backgrounds. overlay(name) paints a weather
overlay on top of what is already drawn. They look the same as on a pushed app.
The names are in the effect and overlay lists. Both return
false for an unknown name.
You decide the layers by the order of your calls: effect() first, then your content, then
overlay().
class Calm
  var fx

  def init()
    self.fx = {"speed": 0.4, "palette": "Ocean"}   # built once
  end

  def draw()
    effect("Plasma", self.fx)
    text(10, 6, "HI", 0xFFFFFF)
    overlay("snow")
  end
end

return Calm()

- Build the settings map once, in
init(), and keep it in a member. A map written insidedraw()is created 40 times a second and wastes memory. - Pass the map on every frame.
effect("Plasma")without it uses the default settings, so leaving it out on some frames makes the background flicker between two looks. - Effects are bright and busy. For readable text on top, lower the speed and pick a darker palette.
For text, icon and chart areas that AWTRIX lays out for you, see Layouts.
Good to know
- The font resets every frame. Call
font()indraw(), not insetup(). - Build lists and maps once, in
init(). One written insidedraw()is built 40 times a second. - Whole numbers divide without a remainder:
7 / 2is3, and50 / 100is0. Multiply before you divide. - Do not name a variable like a built-in call. A variable called
texthidestext(), and the next call to it fails. Call itlabel. - Two moving texts at a time. A third one makes all of them start over in every frame.
Details
Every drawing call. They work only in draw(). Anywhere else they do nothing and raise no
error. width(), height() and the measuring calls work in every hook.
| Call | Does | Example |
|---|---|---|
width() |
display width in pixels | var w = width() |
height() |
display height in pixels | var h = height() |
clear(color?) |
fill the frame; black when omitted | clear() |
pixel(x, y, color) |
one pixel | pixel(0, 0, 0xFF0000) |
line(x0, y0, x1, y1, color) |
a line | line(0, 0, width() - 1, 7, 0x00FF00) |
rect(x, y, w, h, color) |
rectangle outline | rect(0, 0, 32, 8, 0x333333) |
rect_fill(x, y, w, h, color) |
filled rectangle | rect_fill(0, 6, 10, 2, 0x0000FF) |
circle(cx, cy, r, color) |
circle outline | circle(4, 4, 3, 0xFFFFFF) |
circle_fill(cx, cy, r, color) |
filled circle | circle_fill(4, 4, 3, 0xFFD700) |
text(x, y, str, color?) |
text on its baseline; returns how far it moved right | var adv = text(1, 6, "hi", 0xFFFFFF) |
text_width(str) |
how far the text moves right, to chain text | var w = text_width("hi") |
text_ink_width(str) |
how wide the lit pixels are, to fit and center text | var w = text_ink_width("hi") |
font(name) |
another font for the rest of the frame | font("matrix-light6") |
ramp_text(x, y, str, palette, span?, speed?) |
text colored from a palette; returns how far it moved right | ramp_text(0, 6, "HOT", [0xFFFF00, 0xFF0000]) |
scroll_text(str, color?, opts?) |
a line that moves across the display when it does not fit | scroll_text(self.headline) |
scroll_text(x, y, w, str, color, opts?) |
the same, in the columns x to x + w - 1 |
scroll_text(9, 6, width() - 9, self.line, 0xFFFFFF) |
icon(name, x, y) |
an icon at its own size; false if it could not be drawn |
icon("sun", 0, 0) |
bar_chart(list, color?, autoscale?, x0?) |
a bar per value; negative values hang below zero | bar_chart([3,5,2,8,6], 0x00FF00) |
line_chart(list, color?, autoscale?, x0?) |
a line through the values | line_chart(self.history, 0x00AAFF) |
progress(pct, color?, bg?, x0?) |
a progress bar in the bottom row, 0–100 | progress(64) |
effect(name, settings?) |
animated background | effect("Plasma", self.fx) |
overlay(name, settings?) |
weather overlay, drawn on top | overlay("snow") |
rgb(r, g, b) |
a color from red, green, blue (0–255 each) | pixel(0, 0, rgb(255, 128, 0)) |
hsv(h, s, v) |
a color from hue (0–360), saturation and brightness (0–100) | hsv(second() * 6, 100, 100) |
Charts:
coloris white for the charts by default.progressdraws a green bar on a white track by default.- All three take a palette instead of a color, which colors each bar by its value:
bar_chart(vals, "Heat"). autoscale(defaulttrue) scales the chart to the data's own minimum and maximum.falsefixes the range at 0–8.- Charts show at most 16 values. Extra values are dropped.
x0is the column where the drawing starts,0by default. The bar still fills halfway at50, and a palette still runs its full range.
Effects: settings is an optional map: {"speed": 0.5, "palette": "Lava", "blend": true}.
Palettes: a palette is the name of a built-in or uploaded palette, or a list of up to 16 colors.
- Plain colors are spread evenly:
[0xFFFF00, 0xFF0000]runs from yellow to red. - A color may be
[color, pos]withposfrom0to100(percent along the ramp):[[0xFFFF00, 0], [0xFF0000, 30]]reaches red a third of the way and stays red. - Within one list, either every color has a position or none has.
- A palette name AWTRIX does not have draws nothing.
Charts, effects and overlays take a palette in place of their color, too.
Related
- How the display works: the model, with pictures
- Text & colors: fonts and scroll options of pushed apps
- Charts & drawing: the same drawings in a pushed app
- Layouts: boxes that AWTRIX lays out for you
- Icons: getting icons onto the clock